Dashboards have become a hot topic across a widening range of application areas over recent years. However, it is important to remember that “dashboard” is much more than just a buzzword.
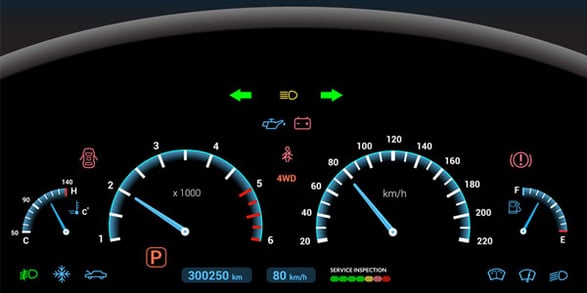
Just as the dashboard in your car is designed to organize and present a variety of information in a logical, prioritized and easy-to-interpret manner for fast on-the-fly decisions, an effective software dashboard needs to follow similar disciplines.
Next time you get into your car, consider how the most relevant and time-critical information, such as speed, RPM, fuel level and engine temperature, is very prominent while many other issues are monitored in the background and presented as “alerts” to catch your attention when needed, such as check-engine lights, low-fuel alerts, etc. Also, as cars have become more complex, other key indicators have been incorporated into the dashboards, such as lane-departure warnings, collision-avoidance alerts, etc. The rise of even smarter vehicles, such as driver-assisted, self-driving and location-based information technologies, will use advanced next-generation dashboards to incorporate richer content about trip-status, ETAs, traffic updates, and much more.

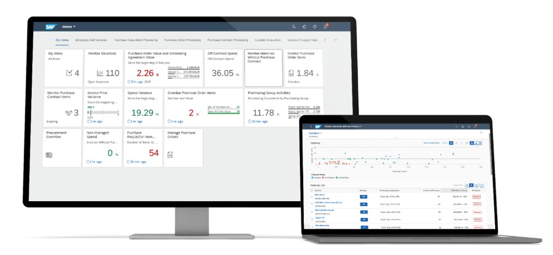
In many ways, the evolution of software dashboards is following a similar progression. Most early dashboards focused only on specific software applications or a set of narrowly defined metrics that were deemed important for managing that specific application or function. However, in too many cases, this forced users to jump between different dashboards or to use ad hoc offline spreadsheets to combine information to understand the broader picture. These shortcomings have led innovators in the software industry to create smarter and more comprehensive dashboards that pull together and integrate a wide range of information from various applications across the whole enterprise.
The first step in creating a dashboard should be to decide on the crucial KPIs that you need to be monitoring and how best to visualize them. For example, in the car analogy, some people see gas mileage as most important and others are more interested in how many miles are left in the tank. Still others on long trips might care most about average speed over a period of time or distance. The main issue is understanding what drives your business and how you can use a dashboard to do your job better.
The keys to success with new-generation, integrated dashboards include:
- Deploying comprehensive cloud-based analytics to unify data from multiple sources
- Normalizing disparate data sets to enhance cross-platform integration
- Creating configurable interfaces that support drill-down, drill-through and drill-back access to transactional information
- Providing ubiquitous web-based access, subject to security and role authorization protocols
- Designing user interfaces for responsive display of information on any desktop or mobile devices
- Building in user-configurability to enable personalized views, tailored visibility and parameter driven alerts
- Assuring forward-looking scalability and adaptability for changing requirements, new applications, and support for digital transformation
At Bramasol, we have been incorporating advanced analytics-driven dashboards into virtually all our implementations, IP-based solutions, disclosure reporting modules and other projects. We have standardized on core enabling SAP solutions, such as SAP Cloud Analytics and SAP Fiori, along with agnostic connector solutions such as SAP Central Finance, Revenue Accounting and Reporting (RAR), and Contract and Lease Management (CLM).

By leveraging SAP Cloud Analytics into dashboards for our pre-built disclosure reporting packages, we are able to give users streamlined compliance solutions to support rapid financial close processes along with a high degree of flexibility for drill-down and drill-through to support issue resolution, audit processes, forecasting and other enhanced analytics.
In addition, we have established a dedicated in-house Advisory Accounting practice with technical accountants and business process experts, who can help clients analyze their dashboard requirements, define targeted KPIs and establish baseline metrics.
The bottom line is we believe that advanced analytics-driven dashboards are essential for success in the Compliance phase of our Comply, Optimize, Transform™ framework, while laying a foundation for the future.
As we move forward, building flexibility and extensibility into dashboard architectures will also play a key role in helping clients move through the subsequent Optimization and Transformation phases, especially with regard to our S/4HANA implementation engagements.

