In previous blog posts, we’ve looked at several key issues facing companies and particularly finance leaders in the Office of the CFO, by covering topics such as Building Finance Innovation on a strong Compliance Foundation, Changing Roles and Responsibilities for the Office of the CFO, The Shift Toward Predictive Accounting, and Analytics is the New Face of Financial Transformation.
A common theme running through all of these posts is the need to unify and connect various data sources, from disparate systems and legacy applications. These blog posts addressed key issues such as having a single-source-of-truth and leveraging a universal journal concept – as well as the value of deploying highly-flexible cloud-based analytics to drill-down and drill-through data in search of actionable insights.
In this blog post, let’s “zoom out” and take a look at the big picture in order to understand the important role that Data Visualization plays in helping companies make better decisions, enhance internal communications and to foster agility for responding to changing business conditions.
Virtually everyone has at one time or another said, “I’ll know it when I see it.” This is often referring to situations where we have a lot of information but are having trouble understanding how it fits together.
In today’s business environments, information is not really in short supply, but clear answers usually are.
That’s where advanced data visualization tools come into play.
While the analytics and business intelligence tools discussed in previous blogs help with parsing, integrating and unifying large amounts of information, data visualization tools are designed to help users actually “see what’s happening” with clarity and transparency, while also providing user-driven interactivity to easily change views for better understanding.
Since the human brain is inherently a pattern-recognition machine, good data visualization tools can quickly connect with our natural preferences for understanding the world around us through pictures and can help “turn on the light bulbs” to guide our thought processes.
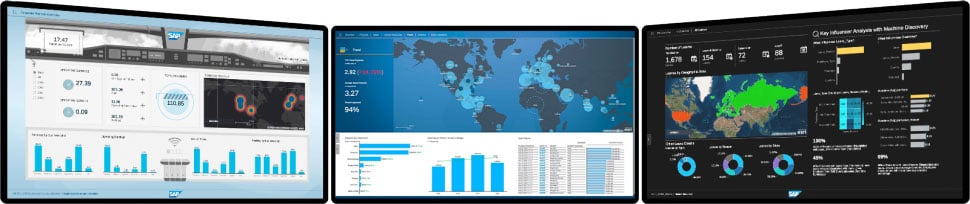
Advanced data visualization solutions, in combination with SAP Cloud Analytics, are able to harness company-wide data from multiple sources and put disparate puzzle pieces together into unified “big picture” views. Designed to maximize user-driven, self-service discovery and interactive viewing, these solutions put corporate users in direct control of how they access and consume information.
From basic visualization tools, such as graphs, pie charts and histograms, to advanced views, such as heat-maps, frequency distributions, multivariate pivot tables, correlations between data sets, and interactive what-if modeling, these advanced solutions put users in charge of how they see the data.
Based on over twenty years of working with CFOs and their staffs across a wide range of industries on Compliance, Optimization and Transformation projects, we at Bramasol understand the dramatic changes in productivity, cross-functional cooperation and improved business results that arise from the integration of advanced data visualization solutions.
By developing additional IP around visualization and reporting tools, we also help companies build out their roadmaps from the initial use of visualization to address pressing issues such on-going changes to compliance requirements on through the longer-term processes of transforming their businesses.
Data visualization is great at bringing together disparate information sources and it gets even better when combined with the underlying architectural advantages of advanced software environments, such as SAP S/4HANA, which puts all operational data in memory and uniquely aligns data, applications and the users’ experience to maximize clarity, accessibility and decision-making agility.
For more information, please visit us at SAPPHIRE NOW and ASUG Annual Conference, May 7-9 2019
Click here to book a time for one of our SAPPHIRE demos in Booth 1538